 & Measurement System Analysis(MSA)")
“What’s measured improves”
Peter F. Drucker
Maximizing Quality with Statistical Process Control (SPC) & Measurement System Analysis (MSA)
Statistical Process Control(SPC)
Statistical process control (SPC) is a technique for applying statistical analysis to monitor, measure & control processes. SPC is the application of statistical methods to identify, control, and eliminate the special cause of variation in a process.
Unlock a world of knowledge with just one click: Navigating Lean Digital Transformation
The statistical process control method determines process capability, monitor processes & identify whether the process is operating as expected, whether the process has altered, and whether corrective action is needed. Statistical process control is frequently used conversely with statistical quality control (SQC).
One major SPC component or tool is Control Chart, Walter Shewhart introduce it in the 1920s. A control chart is useful in recording data and lets you see when an unusual event, such as a very low or high observation compared with “typical” process performance, occurs.
The primary belief made in the Statistical Process Control process is that it is based on the variation. We can distribute this variation as one of the two types, chance cause variation & assignable cause variation:
- Maximizing Quality with Statistical Process Control (SPC) & Measurement System Analysis (MSA)
- Statistical Process Control(SPC)
- What is the Meaning of statistical process control(SPC)? SPC Full Form
- How to Perform statistical process control (SPC)?
- What is Statistical Process Control (SPC) Chart?
- What is Continuous (Variable) Control Chart?
- What is Measurement System Analysis (MSA)?
- What are the Components for Investigation in MSA?
- What is Repeatability and Reproducibility Assessment (Gage R&R)?
- What are the Basics of Measurement System Analysis?
1. Common Cause (Chance-Cause) Variation–
This is intrinsic to the process and will always be present. This variation exists within the natural variation of the process.
2. Special Cause (Assignable Cause) Variation-
It comes from external sources and indicates that the measurement system analysis process is out of statistical control. When assignable cause variation does occur, the statistical analysis eases the identification of the source can eliminate.
Statistical Process Control is an industry-standard approach for measuring & controlling quality during the manufacturing process. We plot Quality data on a graph with pre-established control limits.
Click here to read Best Book on Statistical Process Control:
John Oakland
Statistical Process Control 7th Edition
Control limits determines the capability of the process and Client’s requirement determines the specification limits.
- Data that is under the control limits shows that everything is operating as expected. Variation within the control limits is probably due to a common cause which is natural variation.
- If data falls out of the control limits, it means that an assignable cause is probably the source of the product variation.
Also Read: VUCA – How You Can Survive In VUCA Environment

Benefits of Real-time Statistical Process Control(SPC)
- Fiercely decrease variability & scrap.
- Reduce costs.
- Scientifically enhance productivity.
- Instantly react to process changes.
- Make real-time decisions on the shop floor.
Statistical Process Control (SPC), which is the foundation for Six Sigma, offers an important method for capturing the Voice of the Process and using data to manage a process. Organizations that practice Statistical Process Control methods as part of a broad quality management system will identify Six Sigma Projects & Kaizen events sooner, complete them more swiftly, and not only hold the gains but continue to improve after a Six Sigma project is finish or not.
What is the Meaning of statistical process control(SPC)? SPC Full Form
Statistics: Statistics is a science that deals with the collection, summarization, analysis & obtaining of information from the data.
Process: It modifies input resources into the output which involves the amalgam of people, methods, materials, and machines.
Control: System, policies, and procedures in place the overall output meets the requirement.
Read Also: Quality Transformation: A Path to Perfection
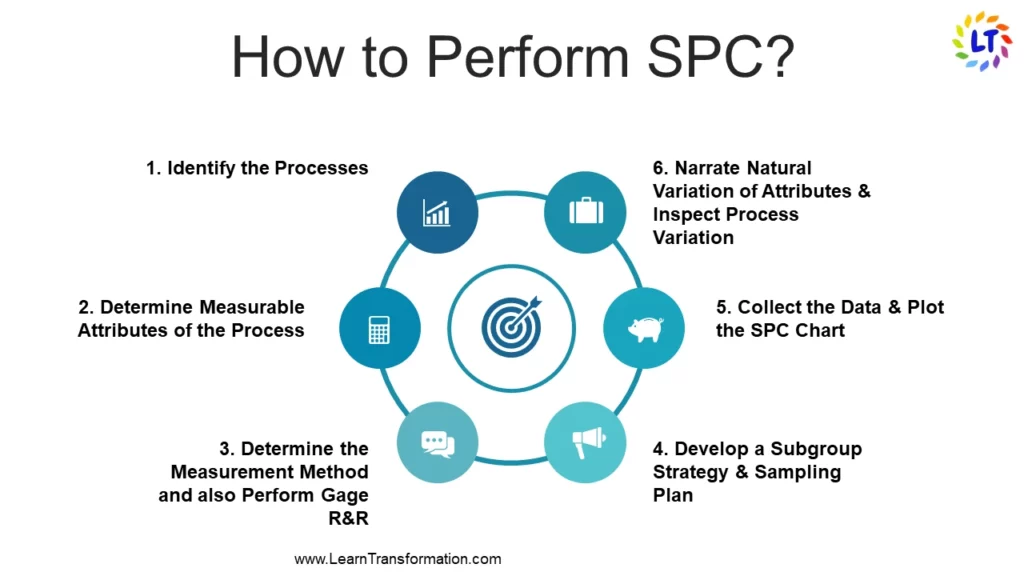
How to Perform statistical process control (SPC)?
1. Identify the Processes:
Find those key statistical process control method that has an impact on the output of the product or the process which are crucial to the customer. For instance, plate thickness impacts the product’s performance in a manufacturing company, then consider the plate manufacturing process.
2. Determine Measurable Attributes of the Process:
Determine the attributes that need to measure during the use of a statistical process control chart in production. From the above instance, consider the plate thickness as a measurable attribute.
3. Determine the Measurement Method and also Perform Gage R&R:
Create a measurement method or procedure including the measuring instrument. For instance, consider a thickness gauge to measure the thickness and create an appropriate measuring procedure. Perform Gage Repeatability and Reproducibility (Gage R & R) to define the amount of variation in the measurement data due to the measurement system.
4. Develop a Subgroup Strategy & Sampling Plan:
Identify the subgroup size based on the product’s criticality & determine the sampling size and frequency. For instance, collect 20 sets of plate thicknesses in a time sequence with a subgroup size of 4.
5. Collect the Data & Plot the Spc Chart:
Gather the data as per sample size and choose a correct SPC chart based on data type (Variable or Attribute) and also subgroup size. For instance, for plate thicknesses with a subgroup size of 4, select Xbar -R chart.
6. Narrate Natural Variation of Attributes:
Compute the control limits. Compute the upper control limit (UCL) and lower control limit (LCL) for both Xbar Range.
7. Inspect Process Variation:
Interpret the control chart & check whether any point is out of control and the pattern.
What is Statistical Process Control (SPC) Chart?
A Control chart is one of the main techniques of statistical process control (SPC). The control chart is a graphical display of quality characteristics which comprises a centerline to show the average value of the quality characteristics and 2 horizontal lines known as upper control limit (UCL) and lower control limit (LCL).
Choosing the right statistical process control chart is essential in control chart mapping. Otherwise, it will end up with inaccurate control limits for the data. The selection of control charts depends on the data type: Continuous (Variable) or Discrete (Attribute).
- Continuous (Variable) Data: It is information that is continuous and measures the values are any real numbers that are measured and noted on the SPC chart. They find out answers to questions like what height, how broad, and how much time passed.
- Discrete (Attribute) Data: It is information that is discretely observed; the values can only be integers that are counted, not measured, and noted on an SPC chart. They answer questions of how often, or what kind. Whenever the feature being watched is observed in the statistical process control tutorial, A data point triggers.
What is Continuous (Variable) Control Chart?
- X bar-R Charts-
- We use X bar-R Chart when data is variable & subgroup size is between 2 & 10.
- We use X bar-R chart to monitor the process performance of continuous data and the data to be collected in subgroups at a set period.
- It is two plots to monitor the process mean & the statistical process control variation over time.
- X bar-S Charts-
- We use X bar- S chart when the data is variable & sub-group size is greater than 10.
- X Bar S charts often used control charts to examine the process mean and standard deviation over time.
- We use these charts when the subgroups have a large sample size and the S chart provides a better understanding of the spread of subgroup data than the range.
- X- MR Charts-
- We use X-MR chart when the data is continuous and also not gathered in subgroups.
- I-MR (Individual moving range) chart is also famous as the X-MR chart.
- It collects a single observation at a time.
4. C Charts (for defects – sample size fixed).
- If the data is discrete, we capture Defects and if the subgroup size is the same, we use the c Chart.
- Use C charts when the data are concerned with the number of defects in a product.
5. P Charts (for defectives – sample size varies).
- If the data is discrete & the subgroup size is varying, we use p Chart.
- P chart is used when the data are the fraction defective of some set of the process output in a statistical process control chart.
- It may be shown how as a percentage of defective.
6. Np Charts (for defectives – sample size fixed).
- If the data attribute, we capture Defectives as well as subgroup size are the same, we use np Chart.
- Np-charts show how the process, measured by the number of nonconforming items (defectives) it also produces, changes over time.
7. U Charts (for defects – sample size varies).
- If the data attribute, we capture Defects & subgroup size is varying, we use the u Chart in the statistical process control example problem.
- U chart displays how the frequency of defects, or nonconformities, is changing over time for a process or system.
What is Measurement System Analysis (MSA)?
MSA is an experimental & mathematical approach that finds out the amount of variation that exists within a measurement process and minimizes the factors putting up to process variation that is truly coming from the measurement system.
Measurement system analysis Six Sigma finds out whether the measurement system is ample for use by evaluating its accuracy, precision, and stability. MSA is the highest misunderstandable & also forgot concept in Six Sigma.
Measurement system analysis (MSA) comprises several techniques to evaluate the performance of a manufacturer’s measurement system. Measurement processes comprise measures, such as gages or software. The measurement system analysis study format aims to conserve the integrity of both the data collection and the data itself. Hence, By going through the information, the analysis provides, companies are better informed of the implications of any measurement error, which leads to decisions about individual products & processes.
Leader’s Tip:
“Continually track process variation using SPC charts to quickly identify and resolve quality issues.”
What are the Components for Investigation in MSA?
There are 5 components to investigate in MSA. The following components of measurement error need to evaluate and pass before establishing process capability and making decisions from the data.
- Bias
- Stability
- Linearity
- Repeatability
- Reproducibility
- Bias/ Accuracy:
Bias is also known as Accuracy. It is the difference between the true value & the value from the measurement system. Accuracy shows the closeness to a defined target. For the best evaluation of the ‘Accuracy’ of the data:
- Accept all data as gathered. Assigning a special cause and inspecting data comes later.
- Record the data at the time it occurs.
- Avoid rounding off the data for effective lean transformation.
- On the data collection plan, record all possible details around the data like the machine, exact source, operator, conditions, collector’s name, material, gage, and time. The data should be protected for misplaced decimal points, missing data points, duplicate data entries by mistake, or improper recording procedures.
- Verify the gauge is accurate. If using a weight scale, verify it with a known & calibrated weight. Then, Use hardness blocks to verify hardness testers.
Bias Assessment-
- Subtract the reference value from x̄ to yield the Bias:
Bias = x̄ – Reference Value
Process Variation = 6 Standard Deviations (Sigma).
- Calculate the Bias %
- Bias % = Bias / Process Variation.
- Evaluate the results. If there is a relatively high value, inspect the following possible root causes:
- Appraisers not following the measurement procedure.
- Instability in the measurement.
- Stability
Stability in measurement system analysis training represents the capacity of a measurement system to produce similar values over time when computing a similar sample. Moreover, Each appraiser should measure the same way every time over a long period & each appraiser should measure the same way as all the others. Hence, A few of the corrective measures include Standard Operating Procedures & re-calibration.
Stability Assessment-
- Choose a part from the middle of the process spread & find out its reference value relative to a traceable standard. So, If a traceable standard is not at hand, measure the part 10 times in a controlled environment and average the values to find out the Reference Value. So, This part/sample will be appointed as the Master Sample.
- The master sample should be measured 3 to 5 times. And also The number of repeats should be fixed. Further, Readings should be taken all over the period to capture the natural environmental variation.
- Plot the data on an x̄ & R chart – consult the Statistical Process Control section of the Toolbox and also calculate control limits.
- Assess the control chart for statistical control.
- Linearity:
Linearity is a test to inspect the performance of the measurement system analysis throughout the range of measurements. Sources of linearity error may come from age, and calibration error. If there is a known error then there may be a calculation to account for it and various ranges of measurement.
- Repeatability:
It evaluates if the similar appraiser can compute the similar sample several times with the similar measurement device & obtain a similar value. Hence, Repeatability will describe the effectiveness of the tool used for measurement purposes.
The aim is to have an appraiser repeat unit readings at least 3 times. The person administering the test should randomize the sequence each time to prevent patterns and bias.
- Reproducibility:
It evaluates if different appraisers can compute a similar sample with a similar measurement device and obtain a similar value.
To optimize reproducibility in Variable Gage R&R:
- Generate a Standard Operating Procedure with visual aids and definitions. When using devices such as micrometers & calipers it all appraisers must squeeze a similar amount. Moreover, Too little or too much pressure at higher levels of resolution can be enough to alter the Gage R&R.
- Visual aids also help. When using an optical comparator to get a higher resolute data point there is a subjectivity to where to place the template or the starting and endpoint on the shadow.
What is Repeatability and Reproducibility Assessment (Gage R&R)?
So, Follow the steps below to perform a measurement system analysis Gage R&R study:
- Find out the number of trials, appraisers & parts.
- Determine 3 appraisers who are well trained in the correct measurement procedure & identify them as A, B & C.
- Fill in the blanks at the top of the form with the needed background information (Gage Type, Date, etc.) and also fill in the blank at the bottom of the form asking for the total specification tolerance.
- Gather 10 parts presenting the range of process variation.
- Determine every part with a number 1-10 in such a way that the appraisers can’t see the numbers as they take the measurements.
- Look at the data collection chart below.
- Begin with Appraiser A & compute each of the 10 parts in random order. A 3rd party should record the results of the first trial in rows A-1st Move to Appraisers B & C and follow the same process. Now repeat the process for trials 2 & 3.
What are the Basics of Measurement System Analysis?
- Find out the number of repeat readings, appraisers & sample parts. Larger numbers of parts & repeat readings provide results with a higher confidence level, but the numbers should be balanced against the cost, time & disruption involved.
- Use appraisers who normally conduct the measurement & those who are familiar with the equipment and procedures in MSA study Excel format.
- There should be a set, documented measurement procedure that is followed by each appraiser.
- Choose the sample parts to represent the complete process spread. This is a crucial point.
- If applicable, label the exact measurement location on every part to minimize the effect of within-part variation.
- Make sure that the measurement device has ample discrimination/resolution.
- Parts should be numbered & the measurements should be taken in random order so that the appraisers don’t know the number assigned to each part or any previous measurement value for that part.
Leader’s Tip:
To validate and enhance measurement systems for accurate data analysis, conduct thorough MSA investigations.
Conclusion
In brief, Measurement System Analysis is not only favorable to consecutive data but also to discrete data categories. So, By evaluating the existing system in an impartial and low incorrect way, MSA makes it possible to compare the prevailing system with its’ future state in a reliable way.
Statistical Process Control helps an organization to assist in specifying the important aspects of essential raw materials and finished products. It also solidifies a consecutive, attentive observation of the finished product which shows any substantial modification in important characteristics.
FAQs
What is Statistical Process Control (SPC)?
Statistical Process Control (SPC) is a methodology that uses statistical techniques to monitor and control a process. SPC aims to detect and prevent problems before they occur by measuring and analyzing the performance of a process over time.
What is Measurement System Analysis (MSA)?
Measurement System Analysis (MSA) is a method used to evaluate the accuracy and precision of a measurement system. MSA is used to ensure that the measurement system used in SPC is reliable and produces consistent and accurate results.
Why is SPC important in manufacturing?
SPC is important in manufacturing because it helps to identify and eliminate sources of variation in a process, leading to improved quality, reduced waste, and increased efficiency. By monitoring and controlling a process, SPC can help to prevent defects and reduce the need for costly rework or scrap.
What are some common statistical tools used in SPC and MSA?
Some common statistical tools used in SPC and MSA include control charts, process capability analysis, and gauge repeatability and reproducibility studies. Control charts are used to monitor the performance of a process over time, while process capability analysis is used to determine if a process is capable of meeting customer requirements.
Key Takeaways
- “By effectively identifying and addressing process variations, SPC enables organisations to maintain consistent quality.”
- “MSA contributes to the provision of accurate and trustworthy measurement data, enabling informed decision-making and process enhancements.”
- Businesses can improve the quality of their products and the efficiency of their processes by combining SPC and MSA implementation.
